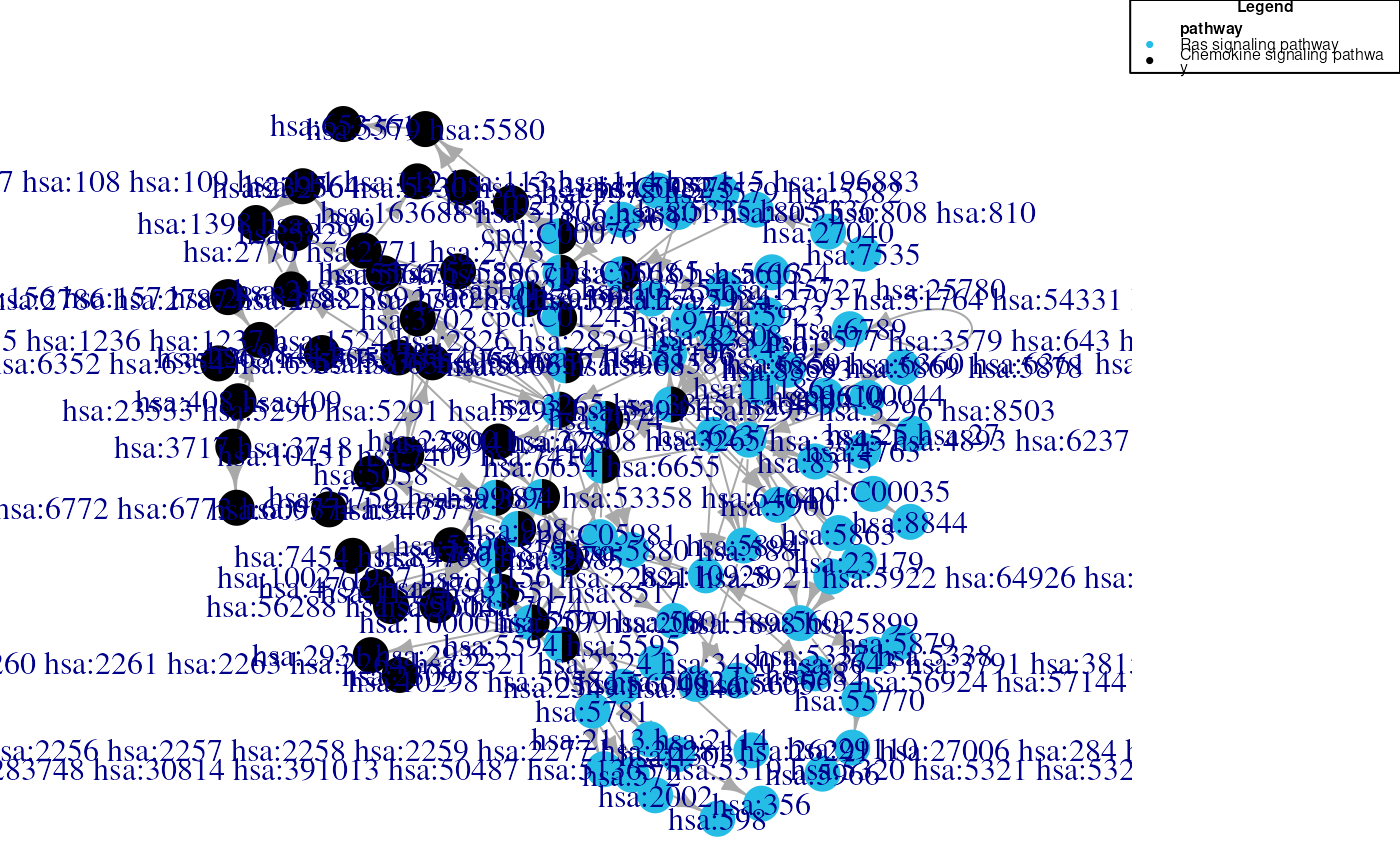
An example igraph object representing Ras and chemokine signaling pathways in human extracted from KGML files.
Examples
data(ex_kgml_sig)
plotNetwork(ex_kgml_sig, vertex.color="pathway")
#> This graph was created by an old(er) igraph version.
#> ℹ Call `igraph::upgrade_graph()` on it to use with the current igraph version.
#> For now we convert it on the fly...
